

Case Study Sports Data · Pilot to Managed QA Delivery

How a Real-Time Sports Data Platform Turned a 14-Day AI-Augmented QA Pilot Into a Managed Release-Confidence System

Live sports data does not give teams much room for almost right. Fixtures, scores, standings, player statistics, odds, widgets, and APIs all have to remain dependable while the product changes. AQA Masters started with a 14-Day AI-Augmented QA Pilot, then continued into Managed QA Delivery to strengthen the QA architecture and release signal around the flows that mattered most.

Engagement summary

A 14-Day AI-Augmented QA Pilot grew into managed QA delivery across the platform’s connected data flows.

Starting point
14-Day AI-Augmented QA Pilot
Continued model
Managed QA Delivery
Product surface
APIs, feeds, web platform, and widgets
Proof
Verified pilot-to-delivery progression
Verified outcome

A Focused Pilot Became an Ongoing QA Delivery Model

  • Measured outcome 14 days

    Focused QA pilot completed

    The pilot inspected the connected product surface, identified critical live-data risk, and established where QA architecture could create the strongest signal.

    Period
    Initial engagement phase
    Denominator
    Approved pilot scope across the connected live-data product surface
  • Measured outcome Pilot → delivery

    QA engagement continued beyond the pilot

    Pilot findings became an ongoing delivery rhythm for coverage, automation, regression, reporting, and release-readiness decisions.

    Period
    Following the 14-Day AI-Augmented QA Pilot
    Denominator
    Approved managed QA delivery scope
  • Measured outcome 4 surfaces

    Connected product areas covered

    Coverage followed APIs, feeds, widgets, dashboards, and their customer data flows rather than isolated pages.

    Period
    Across the managed QA engagement
    Denominator
    APIs, feeds, widgets, and dashboards in the approved product scope
  • Measured outcome Client-owned

    QA operating assets retained

    Coverage logic, scenarios, automation direction, and operating recommendations remained available inside the client’s product context.

    Period
    Across the pilot-to-delivery engagement
    Denominator
    Coverage logic, scenarios, automation direction, and operating recommendations
The Company Behind the Product

When Customers Build on Your Data, Quality Becomes Part of the Product Promise

Behind this engagement is a sports data company serving developers and businesses that turn live and historical information into applications, analytics products, media experiences, and fan-facing platforms. Its data does not stop at one interface. It moves through APIs, feeds, web workflows, and embeddable experiences into products used by customers and their audiences. That reach makes every response, update, and state part of a much larger trust chain.

  1. Fact : 1

    Where the Product Lives

    Product context

    The company is infrastructure for other people’s sports experiences.

    This is a developer-first sports data business operating behind live-score applications, analytics dashboards, sports media products, and fan experiences. Customers do not simply visit the platform; they build their own products and decisions on top of the information it delivers.

    Where the data appears
    • Live-score and fan-facing applications
    • Analytics dashboards and decision tools
    • Sports media and embedded experiences
    What that changes for QA
    • One response can affect multiple downstream products
    • Customer trust depends on data arriving in the right state
    • Quality has to follow the full delivery chain, not one interface

    Business reality The product often works behind the experience, but its failures become visible wherever customers reuse the data.

    QA lens Protect the customer’s product promise, not only the platform’s own screens.

  2. Fact : 2

    What Customers Depend On

    Trust chain

    A live-data product is only as trustworthy as the relationships between its moving parts.

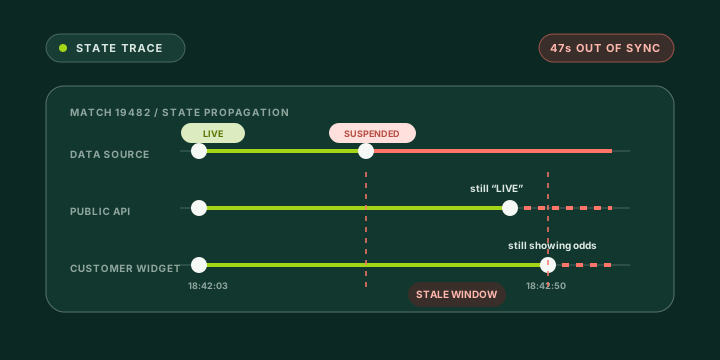
    The connected product surface spans real-time and historical data, developer-facing APIs, data feeds, web workflows, and embeddable widgets. Fixtures, scores, match events, standings, player and team statistics, and changing live states all have to remain coherent as information moves downstream.

    Connected data domains
    • Fixtures, scores, events, and changing match states
    • Standings, player statistics, and team statistics
    • Real-time behavior alongside historical records
    Delivery surfaces
    • Developer-facing APIs and data feeds
    • Web workflows and supporting dashboards
    • Embeddable widgets used in customer experiences

    Release implication A locally correct response can still be wrong when related states, endpoints, or customer-facing views disagree.

    Customer consequence Coherence matters as much as availability when customers build products on changing information.

  3. Fact : 3

    How the Work Began

    Starting point

    The engagement started narrow on purpose: find the leverage before expanding the workload.

    The relationship started with a focused 14-Day AI-Augmented QA Pilot. Rather than trying to test everything, the pilot mapped the customer-critical flows, exposed the live-data assumptions carrying the most risk, and showed where a stronger QA architecture could create useful release signal first.

    Pilot focus
    • Customer-critical live-data flows
    • High-risk assumptions and coverage gaps
    • The strongest first opportunity for QA architecture
    What the client gained
    • A practical view of risk concentration
    • A prioritized direction for useful coverage
    • Evidence for deciding what should happen next

    Pilot boundary The goal was not broad test volume. It was a reviewable proof of where focused QA could create dependable signal.

    Decision unlocked The client could evaluate the operating model through real product context before extending the engagement.

  4. Fact : 4

    Why the Work Continued

    Delivery model

    The pilot did not end with recommendations. Its signal became an operating rhythm.

    The pilot created enough practical signal to become Managed QA Delivery. Coverage, automation direction, regression ownership, and release-readiness reporting moved from a short diagnostic engagement into an ongoing quality rhythm shaped around the way the product and its data actually change.

    Managed responsibilities
    • Risk-based coverage and regression ownership
    • Automation direction around reusable signal
    • Release-readiness evidence and reporting
    Operating shift
    • From a time-boxed diagnostic to ongoing delivery
    • From isolated checks to connected product coverage
    • From late validation to a repeatable quality rhythm

    Engagement evolution Continuation followed practical evidence from the pilot rather than a promise made before the product context was understood.

    Client value The QA model could evolve with the data product instead of becoming another static test inventory.

The Diagnosis

The Risk Lived Across Data Assumptions, Not Only Screens

The client did not need random testing activity around the edges of the product. It needed one risk-based model connecting API behavior, data freshness, customer journeys, regression decisions, automation architecture, ownership, and release evidence. A focused pilot identified the leverage point before the client committed to an ongoing model.

  1. Mechanism 01

    Risk-based coverage

    Critical data paths and customer impact determined where QA attention created the strongest release signal.

  2. Mechanism 02

    Connected data assumptions

    API responses, data relationships, state changes, widgets, and customer journeys were treated as one connected product surface.

  3. Mechanism 03

    Reusable automation direction

    Stable patterns and critical API behavior guided automation toward repeatable signal instead of raw script count.

  4. Mechanism 04

    Managed release evidence

    Coverage, regression, automation, and reporting became an ongoing operating rhythm rather than a final validation event.

From Pilot Proof to Managed QA Delivery

We Proved the Path in 14 Days, Then Operated the QA System With the Team.

The pilot created the first useful signal. Managed QA Delivery then turned that signal into repeatable execution: coverage decisions, test design, automation architecture, regression ownership, and release-readiness reporting.

  1. Phase 01

    Pilot the Leverage Point

    Action

    Reviewed the relevant product context and explored critical live-data behavior to identify risk concentration, coverage gaps, and the strongest implementation opportunity.

    Client-owned asset

    Initial risk view, pilot findings, critical-flow priorities, and recommended QA direction.

    Operational result

    The client gained practical evidence of where QA leverage existed before committing to an ongoing delivery model.

  2. Phase 02

    Map Critical Live-Data Flows

    Action

    Connected data behavior, API responses, state changes, and customer journeys into a risk-based coverage model.

    Client-owned asset

    Critical-flow coverage map and prioritized scenario structure around the live-data paths that mattered most.

    Operational result

    QA effort could follow customer impact and release risk instead of treating every check as equally valuable.

  3. Phase 03

    Create Reliable Automation Architecture

    Action

    Established reusable automation direction around critical APIs, data behavior, and customer-facing flows.

    Client-owned asset

    Automation foundation, reusable patterns, API/data validation direction, and evidence needed to understand failed checks.

    Operational result

    Automation began supporting regression and release decisions instead of operating as a disconnected side project.

  4. Phase 04

    Move Into Managed QA Delivery

    Action

    Embedded the pilot findings into ongoing coverage decisions, execution, automation maintenance, regression ownership, and release reporting.

    Client-owned asset

    Maintained QA cadence, regression model, evolving automation assets, coverage logic, and release-readiness evidence.

    Operational result

    QA became easier to operationalize throughout delivery rather than appearing only as a final validation step.

The Quality System Built

The Client Kept More Than Tests. It Kept a QA Operating Layer.

The work created client-owned assets and a delivery model around how the product actually shipped. Automation became one part of a broader release-confidence system rather than the entire strategy.

01Coverage intelligence

Know which live-data paths deserve protection first.

The client kept a practical model of product risk—not a disconnected test inventory—so QA attention could continue following customer and release impact.

Client-owned assets

2 retained assets

Critical-flow coverage map

A clearer view of the data paths, API behaviors, widgets, and customer journeys that deserved the most QA attention.

Retained inside the client’s QA system

API and data-validation direction

A practical approach for validating response structure, key fields, relationships, state changes, filters, includes, and data assumptions around live sports workflows.

Retained inside the client’s QA system

02Repeatable verification

Turn critical behavior into release signal the team can reuse.

Automation and regression decisions were organized around high-value behavior, giving the client a foundation that could evolve with the product instead of becoming another maintenance burden.

Client-owned assets

2 retained assets

Automation foundation

Reusable automation patterns around high-value flows, built to support regression confidence instead of vanity coverage.

Retained inside the client’s QA system

Regression ownership

A managed rhythm for what gets tested, what gets automated, what requires human exploration, and what must be visible before release.

Retained inside the client’s QA system

03Operational ownership

Keep the evidence and product knowledge inside delivery.

The engagement left behind decision-ready reporting and maintainable QA knowledge, so release confidence did not disappear when a testing cycle ended.

Client-owned assets

2 retained assets

Release-readiness reporting

Clearer evidence for product and engineering leaders so QA output could support a decision rather than only create a list of activities.

Retained inside the client’s QA system

Client-owned QA knowledge

The scenarios, coverage logic, automation direction, and operating recommendations remained useful inside the client’s own product context.

Retained inside the client’s QA system

The Transformation

The Pilot Became an Ongoing Release-Confidence System

The pilot established the initial risk view, showed where QA architecture could create leverage, and gave the client a practical reason to continue. Managed QA Delivery turned that proof into a repeatable rhythm around critical live-data flows.

Before AQA Masters

Visible flows could be spot-checked without one shared risk view.

With AQA Masters

Critical live-data paths were organized into a risk-based coverage map.

Before AQA Masters

Regression risk became clearest near the end of delivery.

With AQA Masters

A managed QA rhythm kept coverage, automation, and release risk visible throughout delivery.

Before AQA Masters

Automation priorities could be disconnected from release value.

With AQA Masters

Automation direction centered on APIs, data behavior, and customer flows needing repeatable signal.

Before AQA Masters

Product knowledge and data assumptions lived across several sources.

With AQA Masters

Client-owned scenarios and coverage logic made important behavior easier to review and maintain.

Before AQA Masters

QA output could become a list of activities.

With AQA Masters

Release-readiness reporting connected QA evidence to product and engineering decisions.

Before AQA Masters

The engagement began as a focused pilot.

With AQA Masters

Useful pilot proof continued into ongoing Managed QA Delivery.

Facing Similar Live-Data QA Challenges?

When Customer Trust Depends on Data That Never Stops Changing

Common warning signs

Signals that a live-data product needs a stronger QA operating layer

This approach is relevant when your product combines developer-facing APIs, real-time or frequently changing data, customer integrations, widgets, dashboards, and release pressure—and a failure can affect many downstream experiences at once.

  1. Warning sign

    API behavior is the product promise

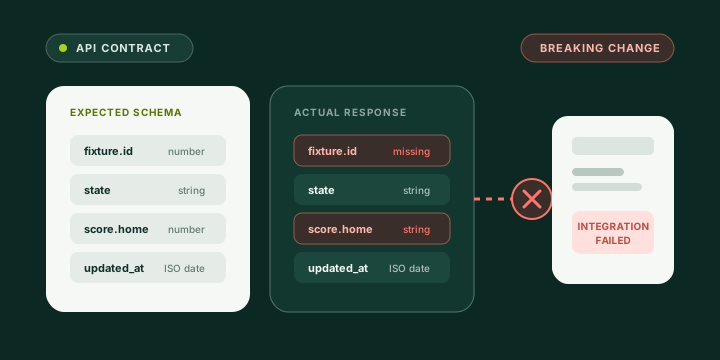
    Contracts, response structures, and relationships must remain dependable for customer integrations.

  2. Warning sign

    Data state matters as much as the UI

    Freshness, transitions, edge data, and connected behavior can fail even when visible pages appear correct.

  3. Warning sign

    Manual regression cannot cover the combinations

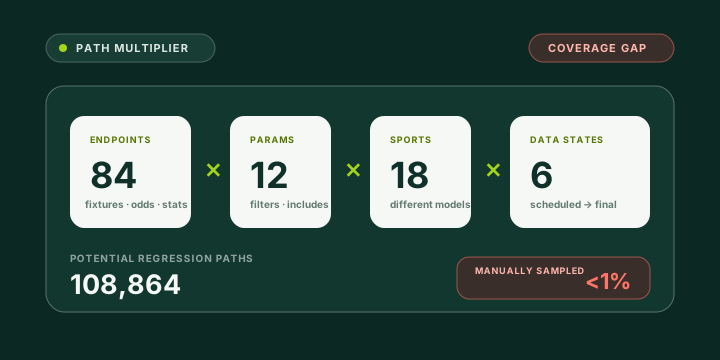
    Endpoints, filters, includes, sports, markets, seasons, widgets, and customer paths multiply faster than manual checks can scale.

  4. Warning sign

    Automation lacks a risk-based architecture

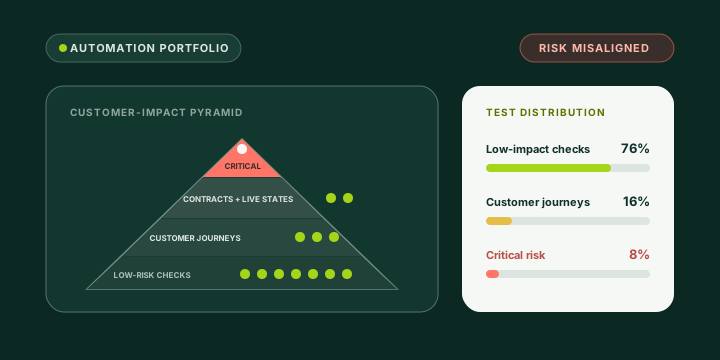
    Tests exist or are planned, but their priorities are not connected to customer impact and release value.

  5. Warning sign

    QA evidence arrives too late

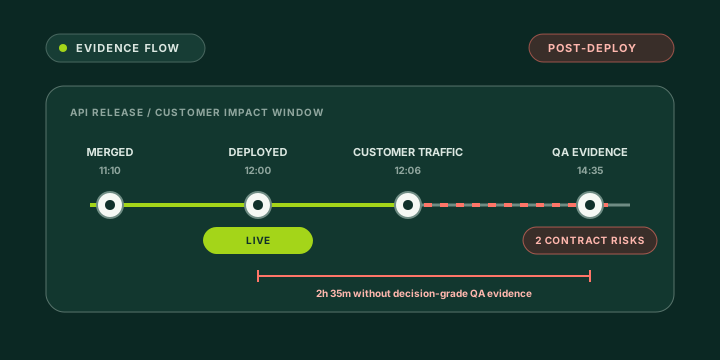
    Coverage and regression findings surface after the team has already committed to a release decision.

Pilot scope · Fixed starting point · Client-owned assets

Bring Us the Live-Data Flow Creating the Most Uncertainty

We will determine whether it can become a meaningful 14-day implementation scope. If the problem is not suitable for the pilot, we will tell you directly.

NDA before access Least-privilege scope Every asset stays yours No long-term lock-in
Horia Adamov, QA Architect
Your call host

Horia Adamov

QA Architect